Two roles. One platform.
Every VisoFlow deployment runs on the same model. Vendors manage at scale. Customers work in isolation. Data never crosses between them.
The Vendor
You run the platform.
Provision new customer environments in minutes. Clone proven setups across tenants. Monitor everything from one place. You never see customer data. Isolation is enforced by the architecture, not by policy.
- Multi-tenant overview
- Clone configurations across customers
- Centralized monitoring
- Zero access to customer data
The Customer
You own your environment.
Work inside a fully isolated lakehouse. Build tables, pipelines, and analytics logic in SQL. You see only your own data. No shared infrastructure, no shared risk.
- Fully isolated lakehouse
- Pure SQL — no DevOps required
- DEV / QA / PROD environments
- Full ownership of tables and flows
One platform. Two roles. Data separation is not a setting. It is the architecture.
What runs under every deployment
Nine capabilities working together. From a single customer to a hundred, without rearchitecting.
Define business rules in standard SQL—no proprietary code required.
Hand off capacity planning to us. We scale as your customer base grows.
Trace every process flow with built-in logging and instant recovery.
Deploy isolated customer lakehouses in seconds, not weeks.
Automate complex data dependencies without babysitting schedulers.
Ensure architectural integrity with built-in security and audit trails.
Built-in logging, auditing, and retries for every customer flow.
Monitor and control multi-tenant costs from a single pane of glass.
Guarantee total data isolation for every end-customer by default.
From source to outcome
Every deployment follows the same path — your data flows through ingestion, into the Command Center, and out to wherever your customers consume it.
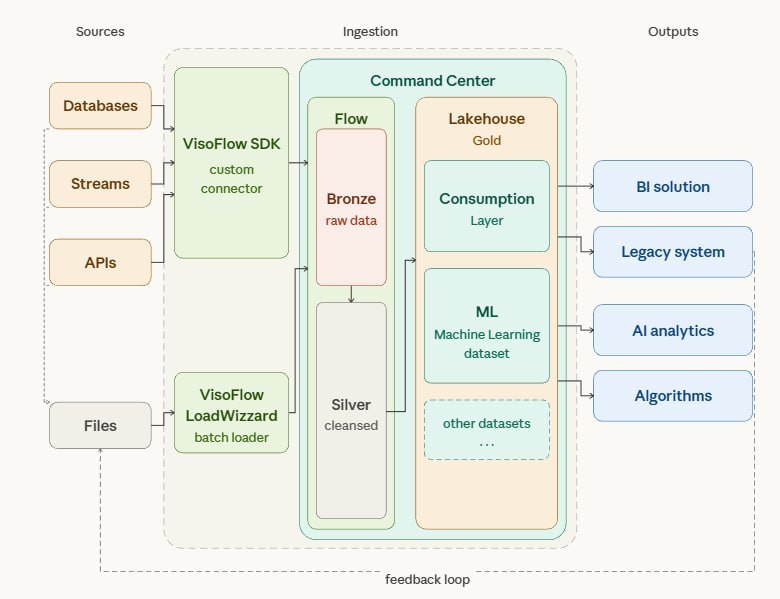
The feedback loop keeps your sources, transformations, and outputs in sync — automatically.
Benchmarked against the alternatives.
140 million records. 30+ files. Here is how VisoFlow performed against well-known solutions and custom builds.
Performance Comparison
Comparison run of 140 million records across 30+ files
| Solution | Data Load | Parsing | Total | Complexity |
|---|---|---|---|---|
| VisoFlow | 2 minutescold start 0 min + loading 2 min | 2 minutes | 4 minutes | + |
| Well-known solutions | 5 minutescold start 5 min + loading 2 min | 4 minutes | 9 minutes | ++ |
| Custom solution | 3 minutescold start 1 min + loading 2 min | 5 minutes | 8 minutes | +++ |
Data Team Size to Build and Maintain
| Solution | Building | Lakehouse Maintenance |
|---|---|---|
| VisoFlow | 1–2 people with business knowledge |
1–2 people with business knowledge Same team — no separate maintenance staff |
| Well-known solutions | 1–2 BI1–2 Data engineers1–2 Architects |
1–2 DevOps1–2 Data engineers |
| Custom solution | 1–2 BI1–2 Data engineers1–2 Architects1–2 Developers |
1–2 DevOps1–2 Data engineers1–2 Developers |
VisoFlow is as fast as other solutions and requires a smaller data team.
Ready to Modernize Your Data Infrastructure?
Stop building internal platforms and start shipping data products. From multi-tenant SaaS architectures to enterprise-grade analytics, VisoFlow provides the automation engine to scale your operations without increasing DevOps headcount.